Unlocking Hidden Hazards: Volcanic Facies and Flank Stability at Whakaari/White Island
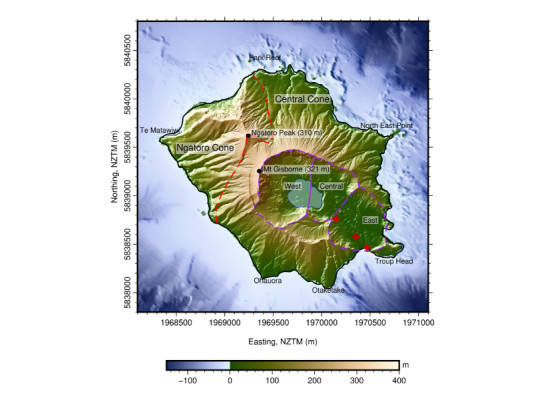
Volcanic islands like New Zealand’s Whakaari (White Island) aren’t just beautiful - they’re living, breathing geological systems. Yet, beneath the surface, hydrothermal fluids can weaken rock structures, secretly setting the stage for dramatic collapse events that can trigger tsunamis.
A recent study by Miller and Tontini (2025)(external link) utilises cutting-edge geophysics and clustering techniques to uncover the layers of vulnerability in this dynamic island.
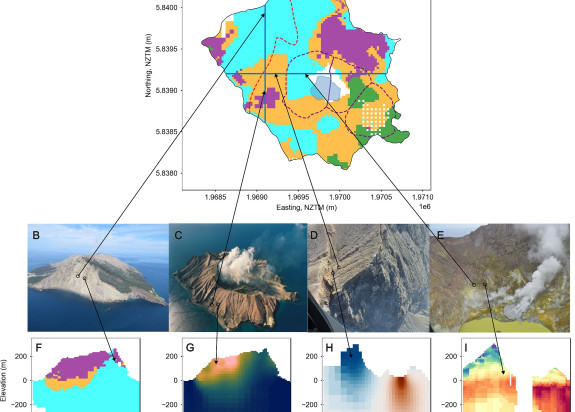
The study employed a suite of geophysical tools, including gravity and magnetic data, airborne electromagnetic surveys, and petrophysical relationships (linking density, P-wave velocity, and effective stress), to scrutinise the subsurface. A clustering algorithm which is a form of unsupervised machine learning parsed this rich geophysical dataset to delineate four distinct facies or rock “types” based on alteration and fluid content which map to spatially distinct zones within Whakaari’s structure.
The study further identified two rock volumes in the west and north flanks that emerged as particularly altered and structurally compromised. These parts likely represent the most fracture- and fluid-saturated zones, flagging potential points of collapse. Elsewhere, especially near the upper flanks, resistance to failure appears to be higher. The resistivity-based saturation models suggest these shallow zones are drier - less likely to play a role in instability but worth watching.
These gravity and magnetic models shed light on sub-crater structures and highlight zones where alteration impacts density, both increases (due to mineral infill) and decreases (from dissolution). This nuanced understanding helps pinpoint areas where mechanical integrity might be compromised, which is vital for comprehending failure mechanics.
Why It Matters: Tsunami Risk and Volcano Monitoring
By isolating specific high-risk volumes of potentially unstable rock, the study equips us with the ability to quantify the rock volumes most likely to fail and embed that data into tsunami simulation models, offering real-world implications for coastal safety. It provides critical context for interpreting real-time monitoring data - such as seismic, geodetic, or gas sensors - by overlaying surveillance data on these mapped facies.
This study represents a leap by integrating multiphysics inversion methods applied to seismic, electromagnetic, and magnetic data with unsupervised clustering to delineate distinct volcanic facies - each characterised by varying degrees of hydrothermal alteration, fluid saturation, and mechanical integrity.
Landslide hazard monitoring at Whakaari, benefits from a high-resolution understanding of its most vulnerable zones. The identification of specific weakened flank zones provides a systematic approach to characterising structural weaknesses and modelling associated landslide and tsunami hazards. With this knowledge, scientists, and emergency planners, can help Bay of Plenty communities better prepare for these low-frequency but high - impact events.